
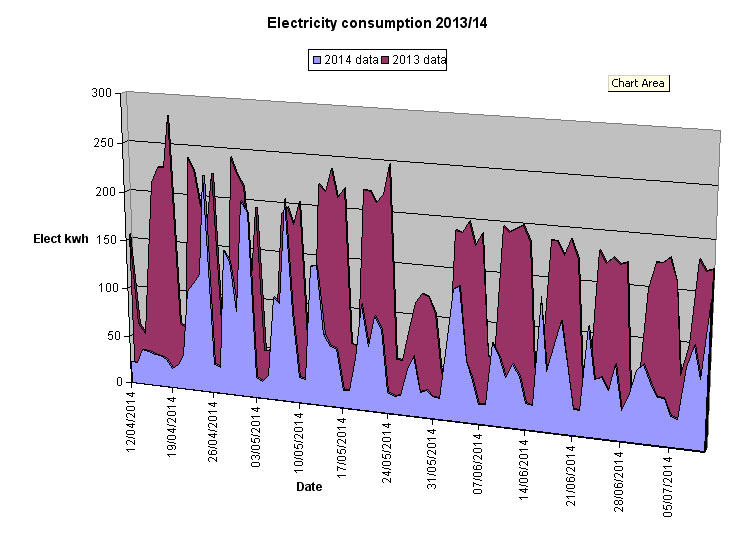
From data provided by the school’s electricity supplier, we can begin to get an idea of the impact that the solar panels are having on the school’s electricity useage. Here is a graph showing daily consumption in kwh over the period April to July 2013 (in red) and April to July 2014 (blue). (If you click on it you should see it in more detail). Consider that the panels were installed in April 2014, you can see straight away that – all other things being equal – they seem to have cut the school’s use of electricity from the grid by more than half. We will need a full year’s data to see the pattern during the darker winter months, but it gives us hope that the panels will reduce the school’s use of grid electricity by at least a quarter.
Note: you can clearly see the consumption pattern of the 5-day week, followed by the 2 day weekend in both charts. The sharp spikes on this appear to be days when the weather was particularly poor, with heavy cloud, so PV output is down, while the school will need extra lights. Can we begin to replace lighting with LEDS? More on this in the autumn…